After the introduction of the probability concept and the rules of probability calculation, I jumped to the applications. Probabilistic Risk Analysis (PRA) is a subject that uses probability and only probability. It does not even need the notions of random variables, which will be covered in the next lecture.
The lecture starts with two student presentations. Bara, a PhD student, presented a summary of the following two papers:
- [KG81] Kaplan S, Garrick BJ (1981). On the quantitative definition of risk. Risk Analysis 1(1): 11-27.
- [K97] Kaplan S (1997). The words of risk analysis. Risk Analysis 17(4): 407-417.
Jason, an MASc student, presented a summary of the following two papers:
- [PC96] Pate-Cornell ME (1996). Uncertainties in risk analysis: six levels of treatment. Reliability Engineering & System Safety 54: 95-111
- [KD09] Der Kiureghian A, Ditlevsen O (2009). Aleatory or epistemic? Does it matter? Structural Safety 31: 105-112
The first set focuses on the definition of risk, whereas the second on the treatment of uncertainties. In my view, any students interested in engineering risk and reliability must read these four papers carefully and re-read them from time to time. A professor’s privilege is such a re-reading opportunity.
Risk
Bara and Jason summarized these two topics very well. KG81 is the second paper of the flagship journal in risk analysis. It really sets the cornerstone for the whole subject of risk analysis. In the paper Kaplan and Garrick defined risk and expressed it using a triplet <si, pi, xi>, with si denoting a hazard scenario, pi the frequency of that scenario, and xi the consequence or outcome of the scenario. Suppose there are N hazard scenarios that have been identified. A special case of the identified scenario is the case N+1: “All else”. This is a tactic used to address a critic that the paper cited but didn’t mention the source:
A risk analysis is essentially a listing of scenarios. In reality, the list is infinite. Your analysis, and any analysis, is perforce finite, hence incomplete. Therefore no matter how thoroughly and carefully you have done your work, I am not going to trust your results. I’m not worried about the scenarios you have identified, but about those you haven’t thought of. Thus I am never going to be satisfied.
This critic actually came from the famous Lewis Report, a review report for the Reactor Safety Study (WASH 1400), the very first probabilistic (or quantitative) risk analysis study in human history. I personally think that this critic is still valid. Using modern language, it was literally pointing out our incapability in front of ‘Black Swan’ events. There are always something that we don’t know we don’t known about. Risk analysis is a very humbling exercise! In this sense, I fully agree with Terje Aven’s proposal that risk analysis is a process of documenting what we know, how much we know and what we don’t know. Aven has two papers that are worth careful reading:
- Aven T (2010). Some reflections on uncertainty analysis and management. Reliability Engineering & System Safety 95: 195-201
- Aven T (2013). A conceptual framework for linking risk and the elements of the data–information–knowledge–wisdom (DIKW) hierarchy. Reliability Engineering & System Safety 111: 30-36.
In KG81, the authors presented the so-called two levels of risk analysis. The simple triplet <si, pi, xi> explained above with pi interpreted as frequency – an objective measure of likelihood – is the level-1 risk analysis. Considering modelling uncertainty – an epistemic uncertainty, the triplet is modified as <si, qi(pi), xi>, with qi(pi) representing the degree of belief on the frequency pi. In other words, Kaplan and Garrick proposed a two-stage treatment of uncertainties in probabilistic risk analysis.
It is because of the unknown unknowns and modelling uncertainties that we should use the term risk-informed decision making, rather than risk-based decision making. Risk analysis can never be truly complete.
In terms of results visualization, Kaplan and Garrick explains the risk curve, sometimes also referred to as Farmer’s curve, which basically is the survival function of consequence. With consideration of epistemic uncertainties, the risk curve turns into a family of risk curve. The paper also explained multi-dimensional consequence situation, where the risk curve becomes a risk surface. The multi-dimensional consequence is also known as multi-attribute consequence.
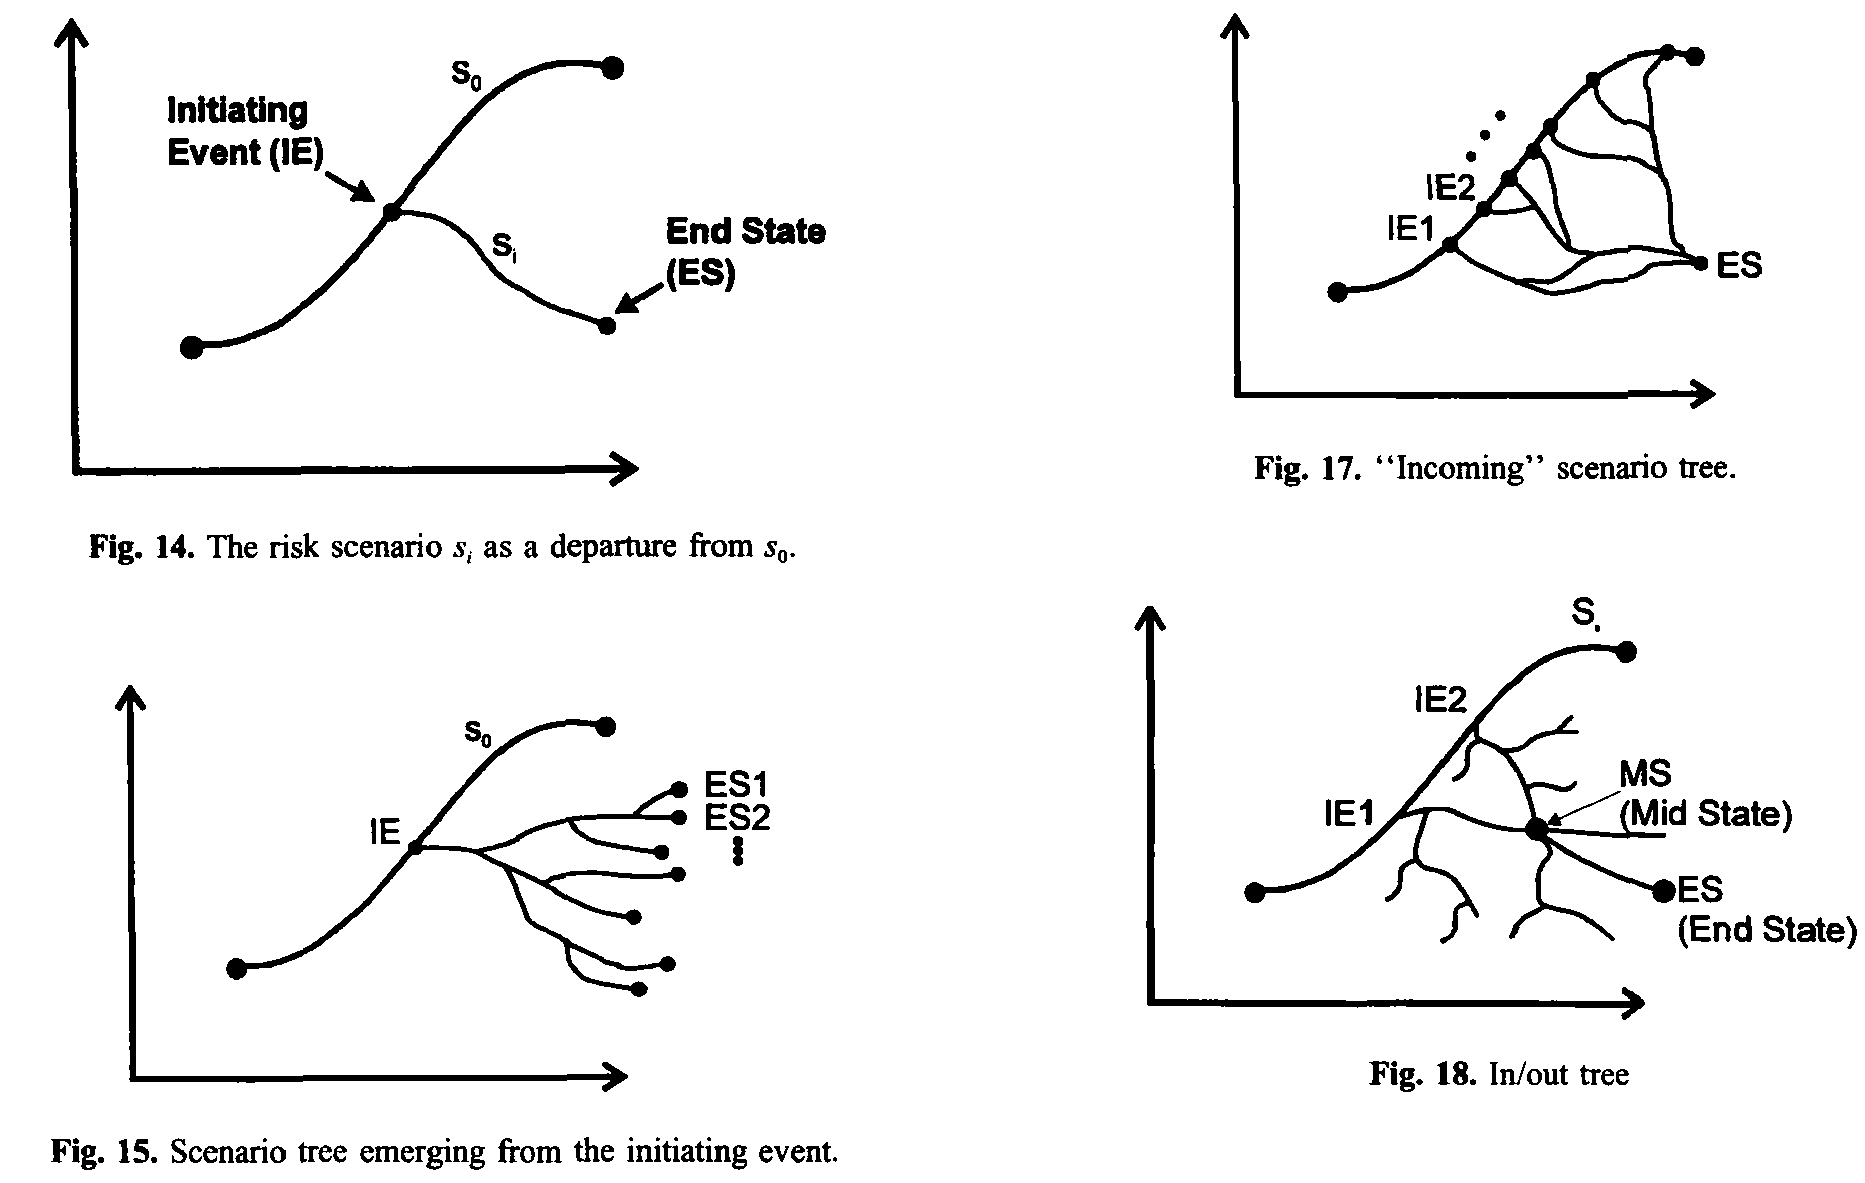
In the second paper [K97], Kaplan extended the risk triplet to the following format: <si, qi(pi), qi(xi)> to cover the complexity in technological systems where the consequence corresponding to a single hazard scenario may be best modelled as a random variable, rather than a deterministic value. Another interesting point that Kaplan explained in the new paper was the dynamic view of scenarios (see below the figures extracted from K97). This immediately connects the risk analysis to event tree analysis and decision analysis.
Uncertainty
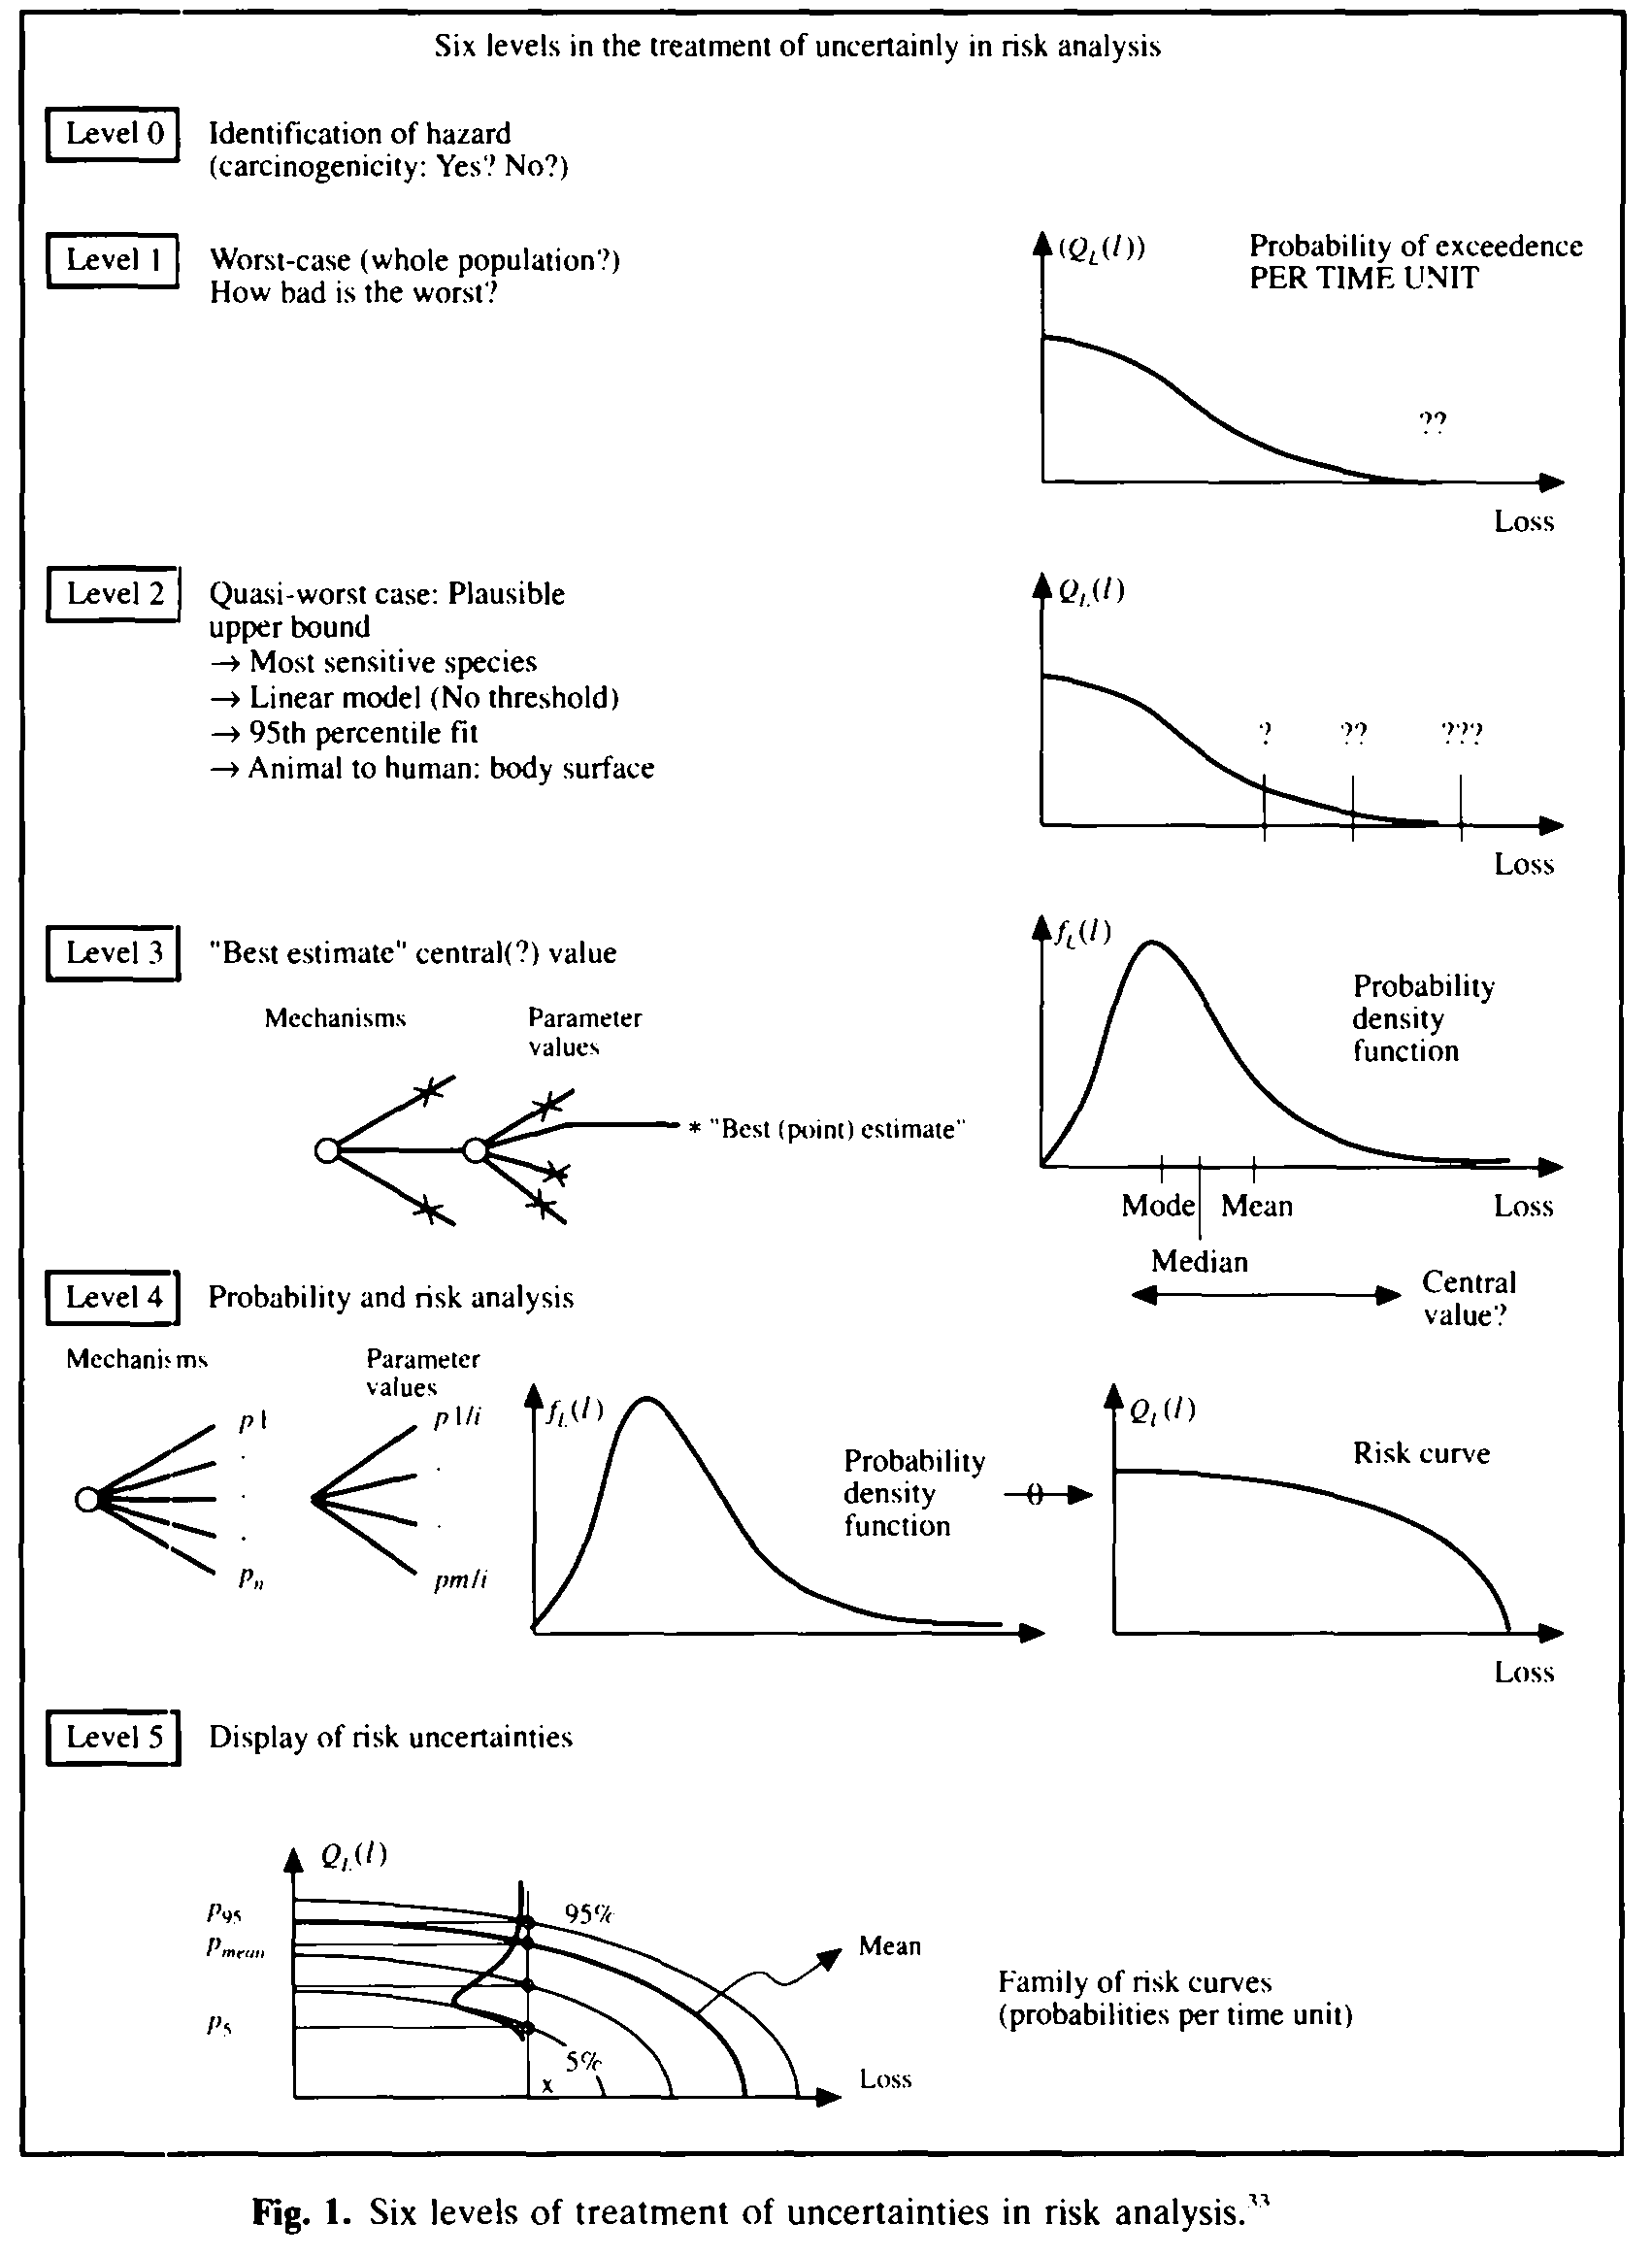
PC96 delineates the various risk analyses from the uncertainty treatment perspective. Prof. Pate-Cornell (Prof. Cornell’s wife) ranked them from Level 0 to Level 5 (see below). This somehow corresponds to the 3 levels of structural reliability analysis and design that was first proposed by Madsen, Krenk and Lind (1985). Level 3 structural reliability covers Pate-Cornell’s level 4 and 5 of uncertainty treatment.
Uncertainty is the raison dêtre of risk and reliability analysis. How to dealing with uncertainties is a fundamental question. Historically, uncertainties are divided into aleatory uncertainty and epistemic uncertainty. But is this kind of categorization necessary? Does it make the risk communication easier or more difficult? [DK09] was first read in a workshop organized by JCSS tribute to Stanford Professor C. Allin Cornell in March 2007.
I first read DK09 not long after I wrote a discussion paper with Field and Grigoriu on model selection (see below). Indeed, I fully agree with Field and Grigoriu, and much earlier, George Box that there are no correct models, only useful ones. Therefore, utility is the very guide. Later I studied the relationship between measurement error and residual error in a regression model. I also studied the nature of chaos and quantum uncertainty. After that I was convinced that at the philosophical level, there are only two types of inherent or aleatory uncertainty: chaos and quantum uncertainty. Interestingly enough, both has to do with measurement. All other uncertainties are epistemic, although, you may treat them (wholly or partly) as aleatory uncertainties, depending on resources and time you can afford to reduce them. DK states that “the characterization of uncertainty becomes a pragmatic choice dependent on the purpose of the application.” I agree, and want to add that the pragmatic choice is often forced to make for managerial reasons.
- Yuan, X.-X. (2009). Discussion of “Model selection in applied science and engineering: a decision-theoretic approach” by R. V. Field and M. Grigoriu, Journal of Engineering Mechanics, ASCE. 135(4), 358-359.
- Box GEP (1976). Science and Statistics. Journal of the American Statistical Association. 71 (356): 791-799
Network Analysis
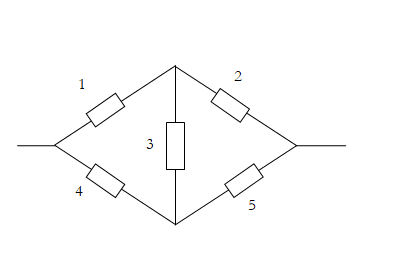
Probabilistic Risk Analysis uses two major techniques: (1) total probability, (2) conditioning. In the lecture, I used a simple bridge network as an example to explain the network reliability analysis. I first explained the reliability analysis of a series system and a parallel system. For the simple network, I first explained the path view and cut view, the concepts of minimal paths and minimal cuts. Then I explained the Inclusion-Exclusion equation (and the Bonferroni’s inequality). Finally, I introduced the conditioning method, which requires the use of conditioning and the total probability formula.
Qualitative risk analysis such as event tree and fault tree methods will be introduced through student presentation next week. Common cause failures are explained in the lecture notes, but left for students to read. Statistical estimation of frequency based on data will be explained later when we get to the statistical module. Estimation of degree of belief using expert judgment is not explained, but Cooke’s monograph can be a good reference. With all these, student should be able to carry out a rudimentary probabilistic risk analysis.
- Cooke, R.M. (1991). Experts in Uncertainty; Opinion and Subjective Probability in Science. Oxford University Press.